NaCl diffusion from a reservoir
Water quality
Problem statement
Consider the diffusion of NaCl inside a pipe that is connected at its origin (\(x\)=0) to a reservoir with fixed concentration \(C_0\). Assume that the diffusion coefficient of NaCl in water is 1.61x10⁻⁵ cm2/s, the pipe length is 1 cm, the concentration of NaCl at the reservoir is 10 mg/L, and the concentration inside the pipe is 0 mg/L.
- Plot the concentration of NaCl inside the pipe after 60 and 120 minutes.
- What is the concentration of NaCl at the end of the pipe after 120 minutes?
Solution
The partial differential equation (PDE) that describes the concentration \(C\) of a substance that is transported by diffusion (\(D\)) in a 1-D domain (\(x\)) is as follows:
\[ \begin{equation} \left\{ \begin{aligned} &\frac{\partial{C}}{\partial{t}} = D\frac{\partial^2{C}}{\partial^2{x}} \qquad 0 \le x < \infty, t > 0 \\ \\ &C(x)|_{t=0} = g(x) \qquad 0 \le x < \infty \\ \\ &C(t)|_{x=0} = h(t) \qquad t > 0 \end{aligned} \right. \end{equation} \tag{1}\]
This PDE can be computed for restricted cases. For the case of a reservoir with fixed concentration at the origin (\(h(t)=C_0\)), and no initial concentration inside the pipe (\(g(x) =0\)) the PDE has the following analytical solution:
\[ C(x,t) = C_0 \cdot \text{erfc} \left( \frac{x}{2\sqrt{Dt}} \right) \tag{2}\]
Where erfc corresponds to the complementaty error function. Lets implement this equation numerically through a function:
Our function receives the initial concentration c0, the diffusion coefficient D, the discretized values for the x domain, and the time.
Note that we are passing an array of values for \(x\), in order to compute the substance concentration at the given domain.
Plot of NaCl concentration
To compute the concentration of NaCl inside the pipe we are arbitrarily discretizing the domain in 41 points. Note that we need to provide the time in seconds and the length in cm, in order to keep consistency with the units of the diffusion constant D.
Finally, we will use a matrix array named ctx to store the concentration of NaCl inside the pipe at the different time intervals, to track the evolution of concentration. Thus our array will have a shape of 4 rows and 41 columns.
from numpy import linspace, vstack, empty
from matplotlib import cm
import matplotlib.pyplot as plt

c0 = 10      # initial concentration in mg/L
D  = 1.61e-5 # diffusion coefficient NaCl in cm^2/s

mtime = [15, 30, 60, 120]           # time in min
stime = [t*60 for t in mtime]       # time in seconds
x     = linspace(0,1,41)            # distance in cm
ctx   = empty((len(mtime), len(x))) # container of concentrations

# concentration as a function of time
for i, t in enumerate(stime):
    ctx[i, :] = conc(c0, D, x, t)

# plot results
fig, ax = plt.subplots(figsize=(6,6))
colors  = cm.get_cmap('bone_r', len(mtime)+1)
ax.set_prop_cycle(color = [colors(i+1) for i in range(len(mtime))])
for i, t in enumerate(mtime):
    ax.plot(x, ctx[i, :], label='%i min'%(t) )

# axes decorators
ax.set_xlabel('distance [cm]')
ax.set_ylabel('NaCl [mg/L]')
ax.set_title('NaCl diffusion in water')
ax.legend(edgecolor='k')
plt.show()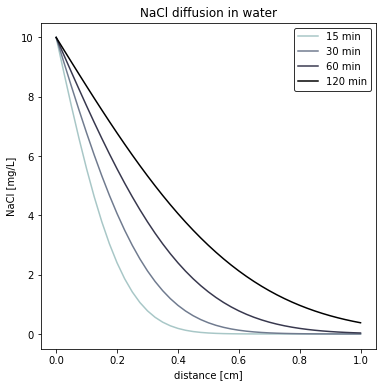
NaCl concentration at the end of the pipe
Since we stored our results in the ctx array, the concentration of NaCl at the end of the pipe corresponds the last column of the array. Thus we can slice the array and print the values to obtain the values:
NaCl concentration at the end of the pipe:
15 minutes: 0.00 mg/L
30 minutes: 0.00 mg/L
60 minutes: 0.03 mg/L
120 minutes: 0.38 mg/L
Note that NaCl starts flowing at the end of the pipe after aprox. 1 hour, since there is no restriction at this boundary.
Follow up
- Compute the concentration of NaCl at the middle of the pipe after 120 minutes.
- Compute the concentration of NaCl at the end of the pipe after 3 hours.
- Modify Equation 2 to locate the reservoir at the end of the pipe.